
Newsletter
Newsletter
Publishers’ strategies are focused on increasing engagement. We summarise the increasingly sophisticated ways that they are measuring it.
3rd November 2023

In the Pugpig weekly media bulletin, Pugpig’s consulting services director Kevin Anderson and digital growth consultant James Kember distill some of the best strategies and tactics that are driving growth in audiences, revenue and innovation at media businesses around the world.
At Pugpig Consulting, we are helping customers get the most out of their analytics by:
If you want to know more about how we are working with publishers like you, get in touch at info@pugpig.com.
Successful media businesses have always been about the quality of your relationship with your audience. It is why In our recently released report on Retention Economics, we reframed retention as relationship management focused on long-term value rather than churn management that focused on short-term KPIs. And it is why engagement has replaced simplistic measures of reach as the key metric for media managers.
But what does engagement mean and how do publishers and editorial managers operationalise it? The evolution of measurement of engagement tracks the evolution of media business models. With the shift to digital subscriptions more than a decade ago and then the development of various forms of registration, measuring engagement has become ever more important and ever more sophisticated as companies look to optimise their conversion and retention strategies.
In the middle of the past decade, consumption metrics ruled with pageviews being the god metric for many publishers seeking scale. But even then, engagement metrics such as pages per session, dwell time and sessions per user were in the mix.
The focus for many publishers changed with the shift from ad-centred to reader-revenue-centred businesses. In a common Media Bulletin theme, when strategies change so do the metrics needed to measure success, and with this shift in media business models, engagement metrics really came into their own.
The Financial Times adapted the marketing framework RFV. For retailers, it stands for recency, frequency and value: when was the last time a customer made a purchase, how often they make a purchase and the value of their spend. For the FT, the V in RFV stands for volume, the amount of content that a customer consumes. The FT’s data team “found that frequent and deep usage of the FT correlates strongly with a high likelihood to subscribe, and a low likelihood to unsubscribe”. It is why at Pugpig Consulting we focus on supporting our customers in building loyalty and habit and measuring that engagement. Subscription teams found that an RFV score could help them determine whether a reader was likely to convert or likely to churn, allowing them to take appropriate action.
As effective as RFV has been for the FT and other publishers, analytics also need to adapt when new challenges arise. Publishers like Der Spiegel tweaked RFV to address issues they were facing with subscriber retention, data scientist Alexander Held said in a detailed case study for The Audiencers. To improve retention, they wanted to be able to objectively measure what behaviours drove reader engagement. Was it a subscription to a newsletter, the use of an app, an ad-free experience or reading articles to their conclusion?
To do this, they added another metric, regularity, to the traditional RFV score. Instead of simply measuring frequency of user visits, they also began to measure the distribution of those visits. It’s an addition grounded in solid research, both from media and other industries. An analysis of 13 terabytes of newspaper data in the US by the Medill Spiegel Research Center found that regularity of use was a better indicator of subscriber acquisition and retention than pageviews or session duration. At Der Spiegel, they made this change after finding that their focus on subscriber acquisition left them with a retention problem. In 2022, their metrics and their activities shifted to try to get as many of their subscribers as possible to “engage with (their) site consistently on a daily basis over the course of seven days”. In addition to adding regularity to their metrics, they also updated the idea of volume in their RFV calculation from the amount of content consumed to the time spent with that content.
And in one last bit of data science magic, the four components of their metric – recency, frequency, regularity and volume – are transformed into a score from zero to 100 using an empirical cumulative distribution function. It is a way for them to assess the statistical significance of their user data, and in practical terms helps Der Spiegel to more easily to note changes in low- to medium-engagement audience members. “This is a deliberate choice to prioritize the development of readers with lower to medium engagement, as increasing the engagement of highly active users is less critical,” Held said. And it allows them to “flexibly determine the importance of regular versus deep usage,” he added. Every user is assigned a score from zero to 100, and they calculate these scores across devices so that they have a 360-degree assessment of user engagement.
This advanced data science approach has allowed them to determine that 40% of their cancellations came from minimally engaged, full-paying subscribers. As we have often said, it is the subscriber who doesn’t see the value of their subscription. We like this case study because Der Spiegel’s data also has found that users who were deeply engaged before they subscribed and remained so after they subscribed continued to be paying customers. They opted for long-term subscription plans as well. We like to question our assumptions, and it’s great to see data prove that engagement equals conversion and retention. Q.E.D.
RFV, and Der Spiegel’s variation on it, measure user engagement, but metrics are also evolving to measure engagement with content to help editorial teams make commissioning decisions. Engagement metrics in newsrooms have come a long way, and they have been influenced by reader revenue strategies as well. Already back in 2017, publications like Schibsted’s Aftenposten in Norway and the Seattle Times in the US were starting to segment their metrics based on subscriber activity.
Aftenposten doubled its digital subscribers in a year by focusing on what content resonated with their subscribers. By analysing the paying segment of their audience, they were able to identify content that engaged their customers. It helped them flip their revenue from 60% based on advertising in 2012 to 65% from print and digital readers by 2017.
At The Seattle Times, they created an analytics hub in 2017 that added business intelligence to Google Analytics and Chartbeat data to allow journalists to know how much of the audience was local and how many were subscribers. They also included data not just about stories that were read by subscribers but also content that directly led to or influenced readers to buy a new subscription.
Back at the FT, as they brought analytics into the newsroom, their data team realised that RFV didn’t answer the question that journalists wanted to know.
The number one question that journalists wanted answering after our North Star goal of engagement was introduced, which page views couldn’t answer, was: what do subscribers actually think, and are they really reading?
McKinley Hyden, the Financial Times’s Head of Insights
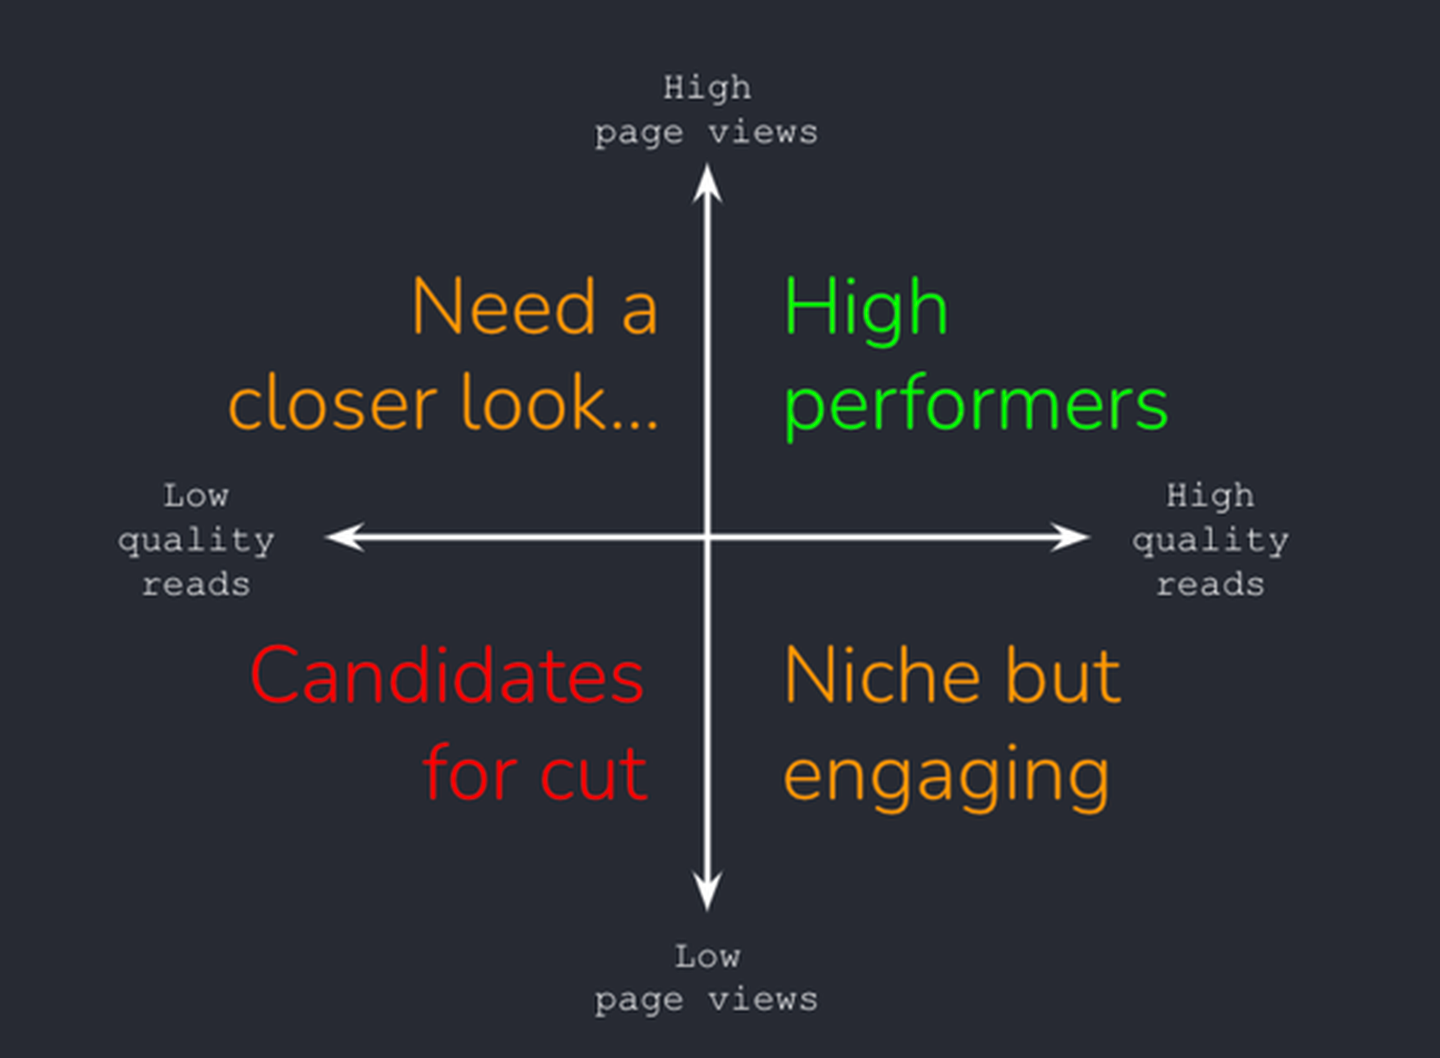
This led them to develop a Quality Reads metric, which like RFV, has been adopted by a number of publishers. Quality Reads is a measure of how many users read at least half of an article based on the word length of the article, the time spent reading the article and the average reading speed of an FT reader. It is reported as a percentage of all readers of the story who didn’t hit the paywall, and it is a key metric that the FT uses to determine how engaging a story is. Like RFV, the FT has found that higher Quality Read scores correlate to propensity to subscribe and retention. Again, it is another data point that links engagement to better business outcomes. But it also is a meaningful metric for journalists that shows which stories resonate with readers.
And all of this isn’t to say that page views don’t have a role. The FT has married page views with quality reads to support smarter commissioning. The FT has a goal “reduce the volume of content created by 15% each year in order to focus more time on quality journalism”. By plotting content on two axes, one measuring quality reads and the other page views, they can identify content that could be eliminated.
Last year, at the FT Strategies-Google News in the Digital Age conference in London, product managers and journalists at the FT said that data had become a common language, and engagement has become key to bridging a gap that used to exist between the commercial and editorial teams at publishers. And it is delivering content that resonates more with audiences and develops and maintains the deep relationships needed to build successful subscription businesses.
Here are some of the most important headlines about the business of news and publishing as well as strategies and tactics in product management, analytics and audience engagement.
Newsletter

Newsletter

Newsletter

Newsletter

Newsletter