News
News
Get the lowdown on how we’re digging into customer app data, using it to drive our product strategy and help our customers get the most from our platform. Plus, find out all about two of our newest offerings, Pugpig Basic Insights & Pugpig Advanced Insights.
28th November 2023
This year’s Pugpig Customer Summit was packed full of insightful talks on publishing, strategy and the latest updates from Pugpig HQ. After hearing all about the 2024 product roadmap, we heard from our very own Product Insight Specialist, Lois Mortimer.
We’ve summarised Lois’ session in this post, giving you the lowdown on how we’re digging into customer app data, using it to drive our product strategy and help customers get the most from our platform.
If you prefer to watch, the full recording of Lois’ session can be found here and also at the end of this post.
You’ll also learn all about two of our newest offerings through our integration with the leading product analytics tool, Mixpanel. Over to you, Lois…
Firstly, I’d like to introduce myself – I’m the Product Insight Specialist here at Pugpig. I use data and insight to drive the changes we make to our product roadmap, and I’m also really focused on helping our customers make sense of and make the most of that app data.
I’m going to talk about how we’re using Mixpanel to harness the power of data within our apps to both help ourselves and our customers.
For a little context, when I joined Pugpig around a year ago, we were almost predominantly using data to help our customers track their content performance. We were tracking over one hundred events and properties in our apps and using tools like Google Analytics internally. Now, these are fantastic for tracking content performance and marketing activity but as a product team, we wanted more in-depth data around:
We often found that the tools we were using fell a little bit short. Hypothetically, we had a lot of data available to us but we didn’t have the right tools internally to really scrutinise it in the way we wanted to.
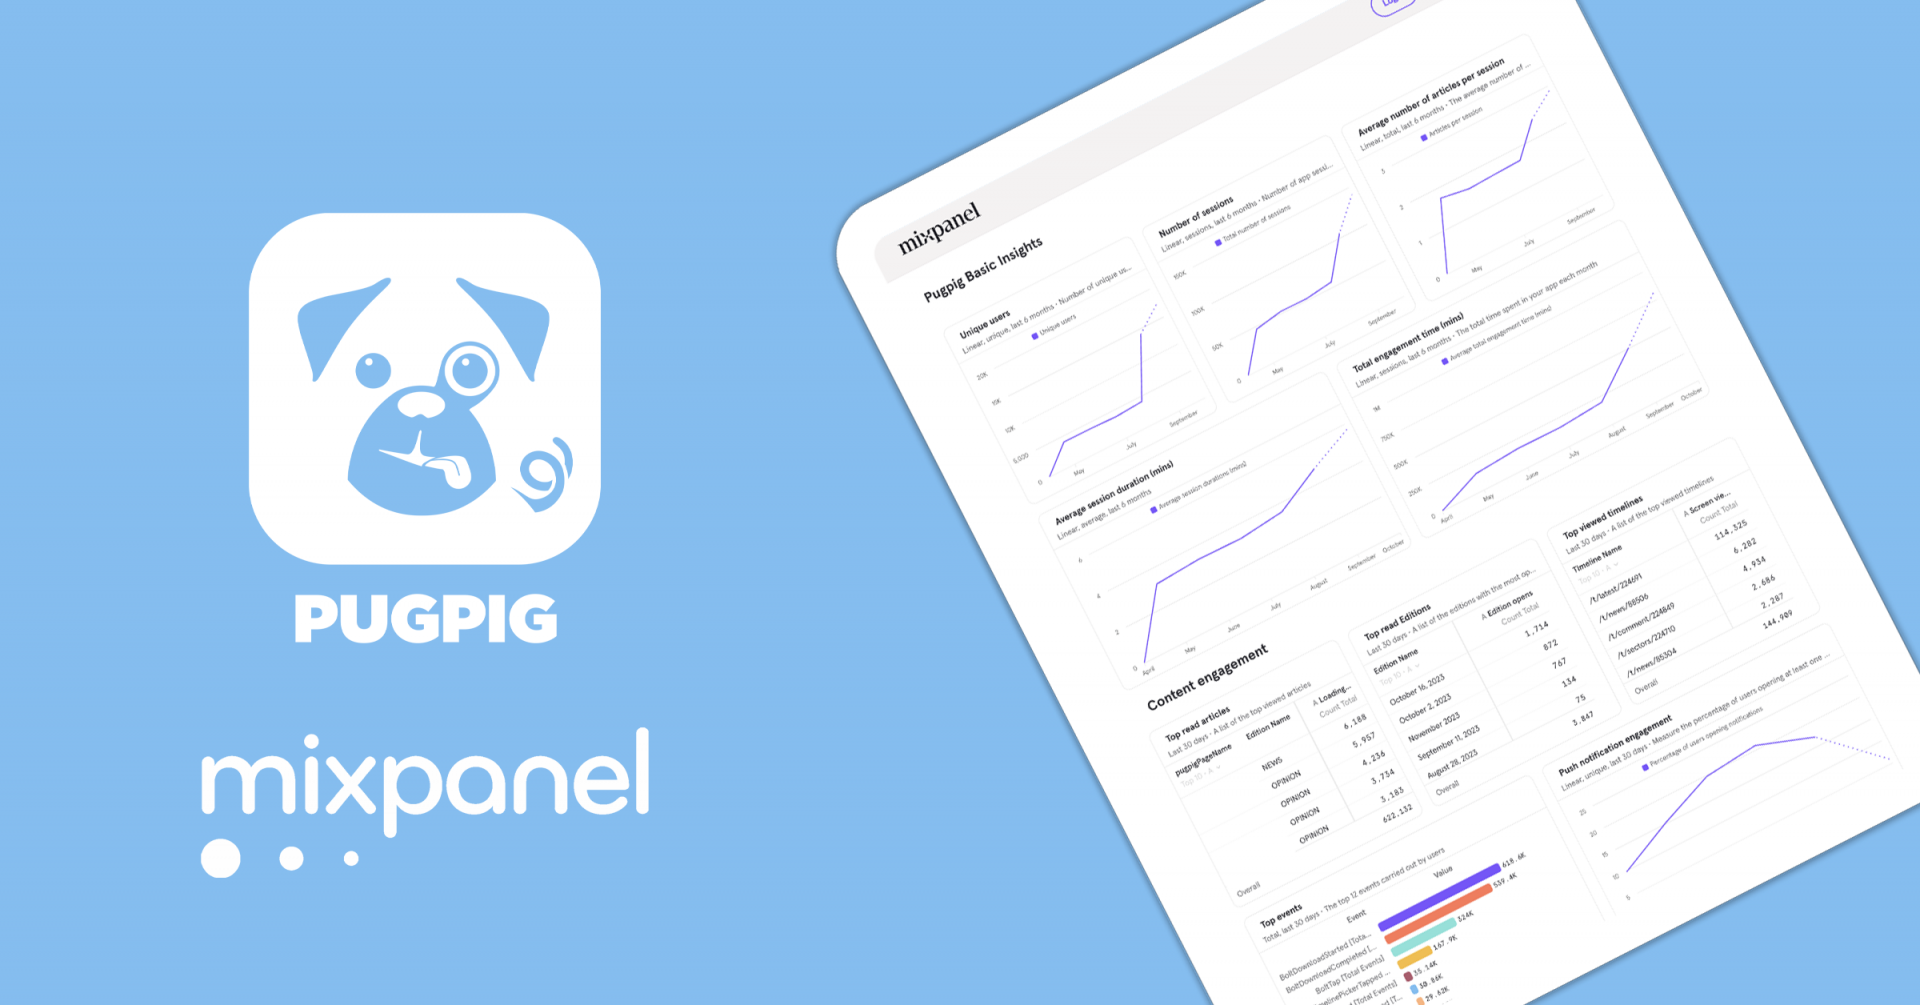
With the looming sunset of Universal Analytics on the horizon, we started looking for a tool that would enable us to aggregate our data and also look at it at a customer level. We decided to go ahead with Mixpanel – a best-in-class product analytics tool.
Since we started using Mixpanel in spring of this year, it’s really started making waves here at Pugpig. First of all, it’s made it really easy for us to start to embed data-driven decision making into everything that we do as a product team by giving us the data at our fingertips.
From deciding the course of our product roadmap to our wider product strategy, we’re really making a concerted effort to ensure that data is included in those decisions.
It’s also enabled us to start to track and define some key product metrics to measure the health of our business and understand how the decisions we make impact those metrics. We are now able to answer our customers’ questions quicker and with more detail.
For example, a lot of product managers we speak to would ask questions like ‘why has a particular metric dropped?’ or ‘what impact has the latest app update had on a key metric?’. We’re now able to go into Mixpanel and aid our customers in finding those answers.
Given that we now have a shiny new tool with a relatively low barrier to entry, we’ve noticed that teams across the business have been using Mixpanel to solve problems and to find answers to customers’ questions.
In essence, it’s encouraging a more data-driven culture across the business. And that’s not just within our product team – from project management to customer support and customer success – everyone’s starting to use data to steer their decision-making.
This is also a great opportunity to show you how we actually use the data in practice. Prior to version 3.16 of our Bolt app, whenever a user tried to download an edition from the storefront and it failed, no message would be displayed. The user would try again and often fail again (shown in the left hand orange bars on the chart below).
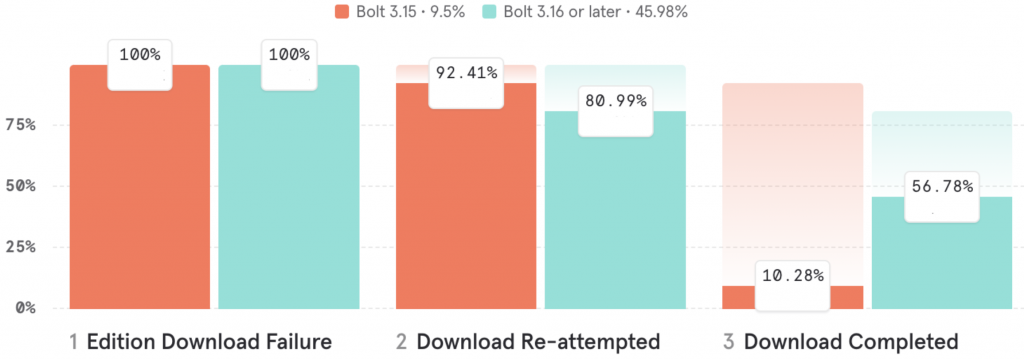
In Bolt release 3.16, we introduced ‘download error storefront messaging’ so now when a user tries to download an edition and it fails, we display a small message letting them know why – maybe their local storage is full or their device is offline, for example.
Essentially, now the user is more equipped to understand why an edition has failed to download and what they can do to succeed in downloading it.
We’ve noticed a marked increase in the proportion of users who, after experiencing an initial download failure, then go on to complete the download. Mixpanel has made it really easy for us to just dive into the platform and use the out-of-the-box funnel reports to look at the user behaviour across different interactions in the app. We can then easily segment the data to see how the story changes between different Bolt versions.
By providing a way to aggregate all of the data across our apps into a single view, it’s also possible for us to start to develop some industry benchmarks. Using Mixpanel we can also surface those benchmarks to our customers, so as well as looking at the industry as a whole, we can also slice and dice the data by the different publishing verticals our customers sit within.
So whether you’re a weekly consumer magazine or a daily newspaper, we make sure that the benchmarks surfaced to you are always reflective of the vertical you sit within and you’re always getting a like-for-like comparison.
Thanks to Mixpanel, we’re also able to deliver two new exciting products.
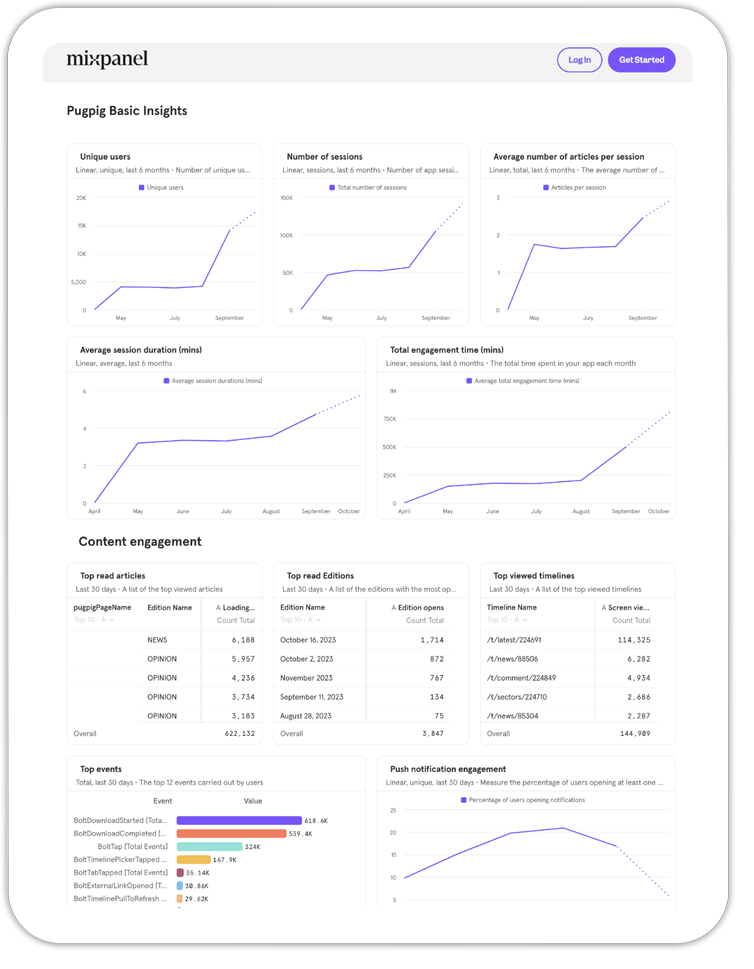
The first of which is Pugpig Basic Insights, which is a dashboard that’ll be surfaced to all of our customers who are using Bolt version 3.15 and onwards. This comes at no additional cost to our customers as it will be included in your Bolt licence.
The dashboard surfaces a range of app performance, content performance and user behaviour metrics to enable you to understand what success might look like for your apps.
It’s currently in a Beta trial at the moment, so we’ve shared it with a handful of customers to collect their feedback and we’re making changes to it as we go. As it currently stands, and please bear in mind that some of the metrics might change, at the top of the dashboard you can see in the screenshot, we’re looking at a range of high-level metrics such as:
We’re also looking at some content engagement metrics such as:
In terms of user metrics, we look at:
We’re also giving you a sense of how sticky your apps are, so what proportion of your users return to your app over a 30-day window and how that compares to the industry average that your app sits within.
Let’s say you’re a news media app – the average that would be surfaced in your dashboard would be that of the news media vertical to ensure you’re always getting that like-for-like comparison.
Where relevant, we also surface some paywall performance metrics such as:
As mentioned earlier, it is a working progress. We’re making changes to the dashboard as we go and we’d be very keen to hear if any customers would like to be involved in the trial – please get in touch with your Customer Success Manager if you’re interested.
We’d love to have your feedback and know what metrics really matter to you so we can make changes accordingly.
We have a second new product we’re going to be introducing which is Pugpig Advanced Insights with Mixpanel – this will be available as an additional licence or could potentially be included in a Enterprise licence.
Essentially, you’ll get unlimited access to all your app data within Mixpanel. You and your colleagues can log into the Mixpanel interface and you’ll be able to query your data to your heart’s content, build reports, build dashboards and share them with your colleagues.
You’ll also get set up with a suite of pre-built dashboards to help get you started, centred around things like editorial metrics, the performance of your paywall and so on.
And of course, you’ll always have the helping hand of the Pugpig support team along the way, whether you need help building your reports or getting your colleagues set up.
To summarise, these are two new really exciting products that we’re looking forward to introducing.
We’re only really just getting started with unleashing the power of data within Pugpig, but we’ve come on leaps and bounds in the last 12 months and I can’t wait to see where we are by the time our next Customer Summit comes around.
Please do get in touch if you’d like to take part in the Pugpig Basic Insights trial or if you have any questions at all. We’d love to hear from you.
News
News
News
News

News